Every BI Team Needs a Power BI Service Monitor
Objective
In today’s data-driven environment, business intelligence teams rely heavily on Power BI to deliver insights across departments. But while dashboards and datasets often take center stage, what happens behind the scenes — refreshes, failures, usage trends, and system health — can significantly affect the quality and timeliness of reporting. That’s where a Power BI Service Monitor comes in.
What is a Power BI Service Monitor?
A Power BI Service Monitor is a centralized solution — often built as a report or dashboard — that tracks the health, performance, and usage of Power BI workspaces, datasets, and reports. It typically uses the Power BI REST API, Admin APIs, and activity logs to provide visibility into:
- Dataset refresh statuses
- Workspace usage
- Report consumption trends
- User access and license activity
- Errors and failures (e.g., scheduled refresh failures)
- API usage limits and throttling
Why Create a Power BI Service Monitor?
- Proactive Issue Management
With service monitoring, BI teams can catch issues like refresh failures, broken data sources, or capacity bottlenecks before business users report them — reducing downtime and increasing trust in the reporting platform. - Governance and Compliance
It helps ensure reports are being shared responsibly and that only authorized users have access to sensitive datasets. - Performance Optimization
Monitoring can reveal datasets with long refresh times or high memory usage, prompting opportunities for optimization (e.g., reducing model size, using incremental refresh). - Audit and Usage Insights
Understand who is consuming what — and how often. This can help prioritize support, retire unused assets, and justify licensing or capacity upgrades. - Change Management
With visibility into who’s publishing reports or modifying datasets, BI leaders can manage changes more effectively and trace issues to specific actions.
Impact on the Team
Implementing a Power BI Service Monitor brings several measurable benefits to the BI team:
- Reduces firefighting: You’re no longer dependent on users flagging problems.
- Saves time: Automates tasks like checking refreshes or tracking adoption metrics.
- Empowers leadership: Provides BI managers with operational KPIs to drive better decisions and resource allocation.
- Builds credibility: Ensures the BI platform is reliable and high-performing, fostering stakeholder confidence.
The Strategic Importance to a BI Team
A Power BI Service Monitor isn’t just a tool — it’s a foundational layer of operational intelligence for the BI team. It transforms your BI environment from reactive to proactive, enabling:
- Reliable self-service BI
- Scalable governance across growing data environments
- Strategic insight into the BI ecosystem itself (not just business data)
Other Relevant Considerations
- Automation: Consider integrating alerts (e.g., via Power Automate or email) when refreshes fail or thresholds are breached.
- Security: Ensure API access is securely managed and aligns with data governance protocols.
- Scalability: Design the monitor to work across multiple workspaces and capacities as your BI environment grows.
- User Adoption: Insights from the monitor can be used to train and support users more effectively.
To Create a PowerBI Service monitor using the connector.
- Download the .mez file from the GitHub repo
- Save the file in your custom connectors folder ([Documents]\Power BI Desktop\Custom Connectors). If the folder doesn’t exist, create it and plac the file in there.
- In Power BI Desktop, select File > Options and settings > Options > Security. Under Data Extensions, select (Not Recommended) Allow any extension to load without validation or warning. Select OK, and then restart Power BI Desktop.
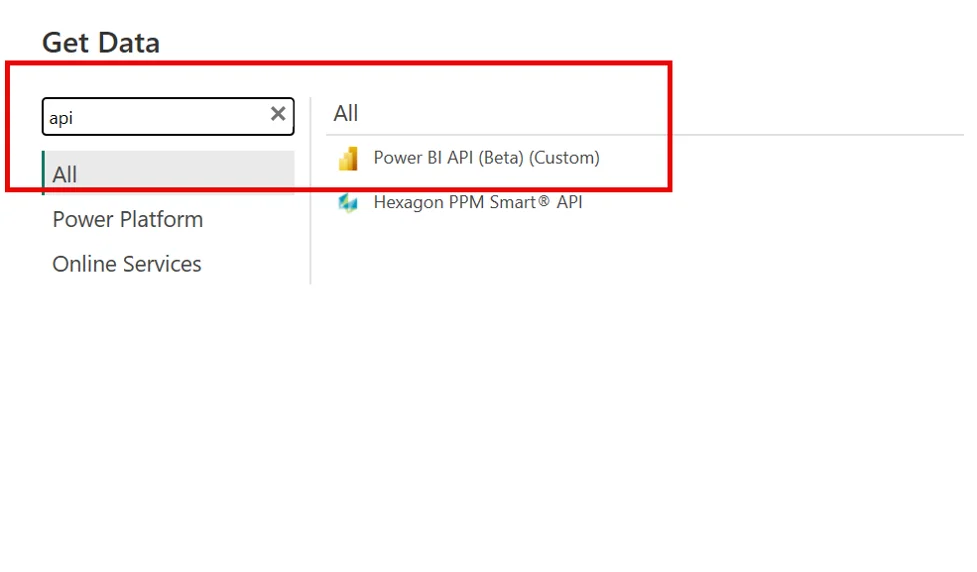
- Open Power BI Desktop and find the connector listed inside the Get Data window
Next Step is to connect to any of the categories based on the Service Monitor Use Case.
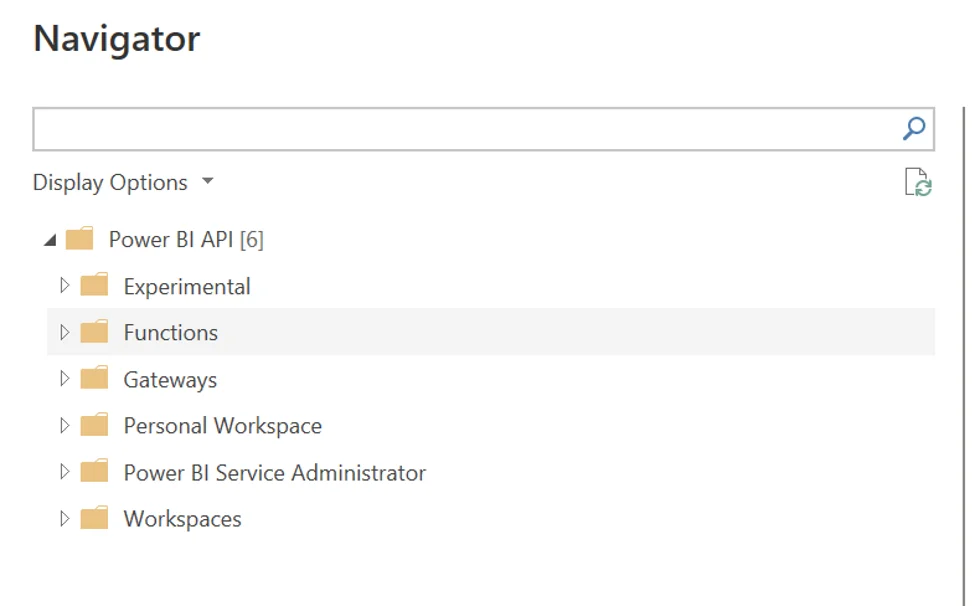
- Experimental
- Purpose: Contains beta or preview APIs that are not yet officially released or stable.
- Use With Caution: These endpoints may change or be deprecated without notice.
- Examples: Early versions of metadata or lineage APIs.
🔹 2. Functions
- Purpose: Offers parameterized Power Query functions to call specific REST API endpoints.
- Use Case: You can provide parameters like workspace ID, dataset ID, or report ID to dynamically fetch:
- Report metadata
- Dataset refresh history
- Users with access
- Examples:
- GetDatasetById(workspaceId, datasetId)
- GetRefreshHistory(workspaceId, datasetId)
🔹 3. Gateways
- Purpose: Provides details about on-premises data gateways connected to Power BI.
- Use Case: Useful for admins managing hybrid data sources.
- Includes:
- Gateway names
- Cluster info
- Gateway data sources and statuses
🔹 4. Personal Workspace
- Purpose: Gives you access to reports, datasets, and dashboards inside your own personal workspace.
- Use Case: If you’re building automation or metadata catalogs for your own content (not shared workspaces).
🔹 5. Power BI Service Administrator
- Purpose: Admin-level APIs that require Power BI Service Admin permissions.
- Use Case: Used for governance, compliance, and audit reporting.
- Includes:
- Audit logs
- Capacity usage
- Workspace inventory
- Dataset refresh statuses
- Users and permissions
🔹 6. Workspaces
- Purpose: Lists all workspaces you have access to and the contents within (reports, datasets, dashboards).
- Use Case: Ideal for building a metadata inventory or lineage tracker.
- Details Available:
- Workspace names and IDs
- Contents (reports, dashboards, datasets)
- Permissions
- Data sources and refresh metadata
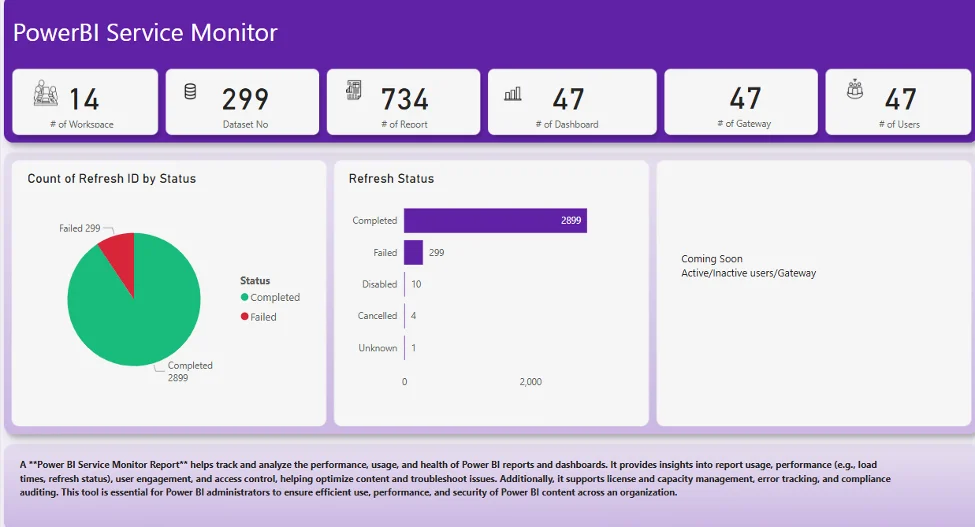
An example of a Power BI Service Monitor High Level Dashboard that shows health and details of the dashboard.