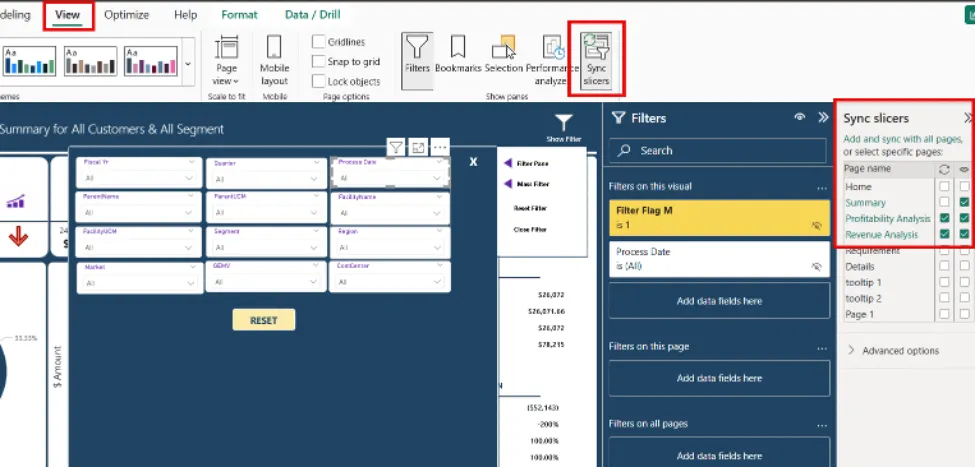
💡 This ensures filters behave hierarchically without needing a physical hierarchy.
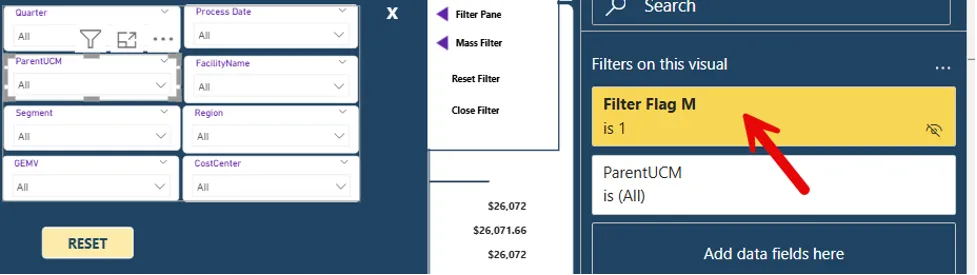
Note: PowerBI provides the option to synchronize filters, be sure to ask users if they would love to enable this feature.
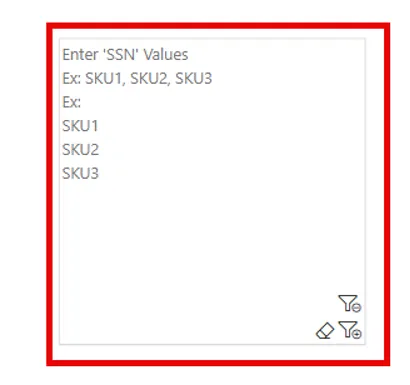
✅ 2. Mass Filter Slicer from Marketplace
- Added the Mass Filter Slicer visual from AppSource
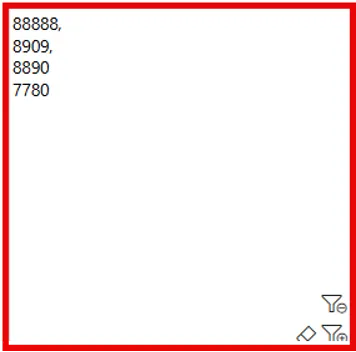
- Allows users to paste a list of IDs or SKUs (comma- or space-separated) from Excel.
🧪 Example:
SKU1, SKU2, SKU3
📋 Streamlined workflow for power users handling bulk SKU/SSN filtering.
Dynamic Fiscal Period Cut-Off Using M Code
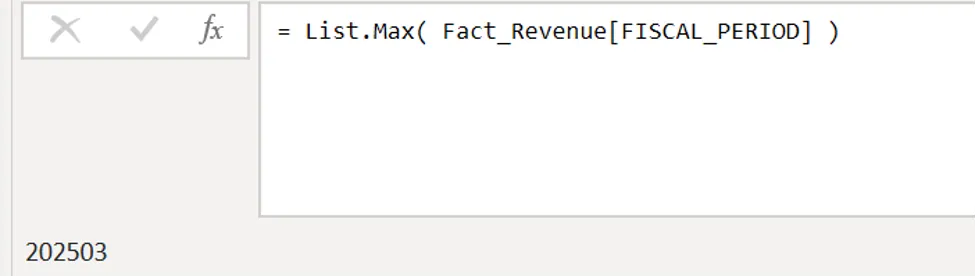
- To synchronize visuals and prevent partial data display, I used Power Query to calculate the latest complete period from the Fact_Revenue table:
MaxPeriod = List.Max( Fact_Revenue[FISCAL_PERIOD] )
- Applied a number filter to each fact table:
FilteredRows = Table.SelectRows(Source, each [FISCAL_PERIOD] <= MaxPeriod)
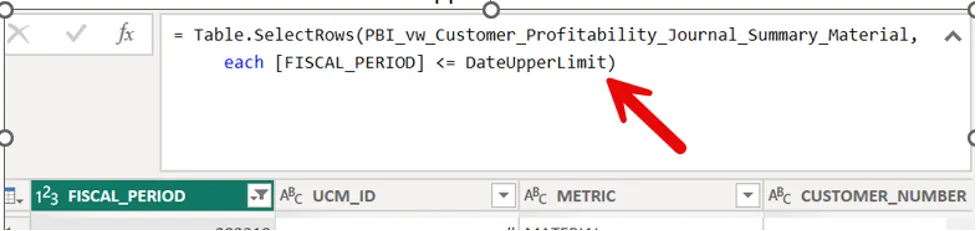
🧊 Ensures consistency across all visuals and avoids misleading insights from partial revenue loads.
Resulting Report Enhancements
- Dashboard only shows complete data up to the freshest available revenue period
- Filters update contextually, simulating hierarchy even across separate dimension tables
- Users can easily paste in bulk ID lists, significantly improving efficiency
- Report now includes:
- Revenue vs. prior quarter delta
- Top customer & segment
- Cost breakdown (Material, Labor, PS)
- Margin impact visuals